

ISEE scores are a lot easier to understand when you compare them to SAT scores. And I think you can learn something about SAT scores by studying the ISEE’s system too. Both are misleading in different ways.
Here’s my informal comparison:
Explaining the Chart
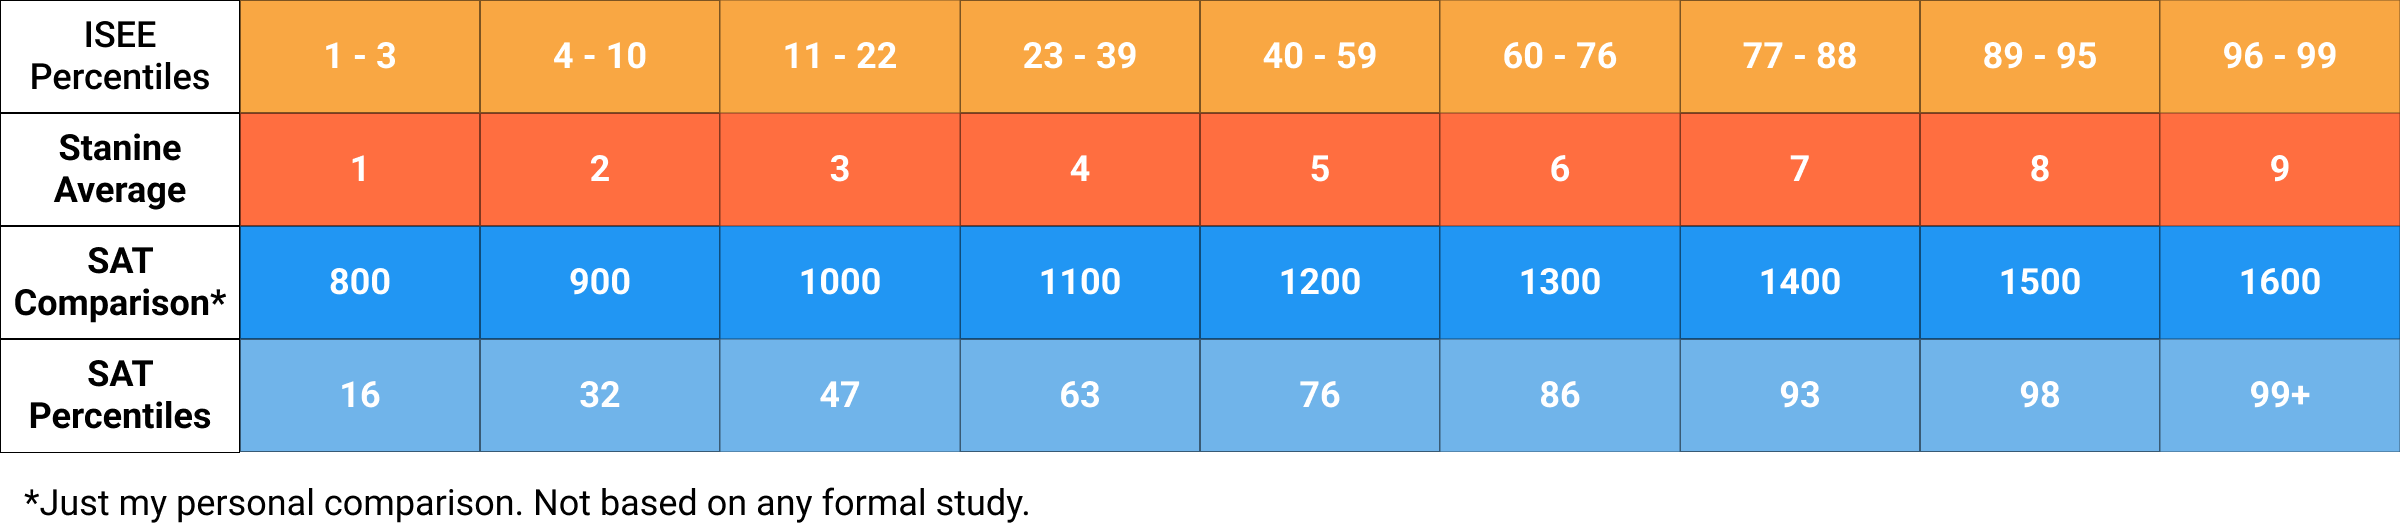
The top two rows refer to the ISEE. The first contains the percentiles – how students did in comparison to other private school students. I bolded that part because it explains why the numbers are low: it’s a more competitive group of students.
The second row contains the stanines1. You notice that the percentile bands are larger towards the center and very small at the ends. Sometimes just one question is the difference between one stanine and the next. This odd system can also undersell the improvement a student has made: a 50-percentile point increase (from low 4s to high 6s) might yield the same 2-point stanine improvement as a 10-percentile point increase (from 87th to 97th), even though the first improvement is often harder to achieve.
The bottom two rows refer to the SAT – its percentiles are based on students who took the test. This is a larger segment of the population, and that’s why the 50th percentile SAT score is lower than the 50th percentile ISEE score.
Yes, I Made It Up
The two companies have never collaborated on a concordance table. This is all based on my observations over time: tutoring hundreds of students in both tests, seeing how my students do on both tests, and seeing how elite high schools and colleges respond to the scores. This chart shows what the ISEE scores would be like, in terms of their value to schools that care about scores, if they were SAT scores.
I’ll go through a few to give you an idea.
If you get an average of 8.5 or 9, no school will have a problem with it, just like no colleges have problems with a 1550 or 1600.
8 is a terrific score too. Like a 1500, it shows that you’re a great all-around student. Counselors may whisper that the scores “could be higher,” but I refuse to believe that this score would be anything but an asset.
It starts to get interesting at 7.5. I still don’t think the scores would hurt you. With a 1450, you’ll still be right around the 25th percentile of accepted students at really top schools before COVID. In other words, before everybody started playing games with the numbers and all schools required test scores, schools like Harvard thought 1450 was okay – roughly a quarter of the students they accepted scored 1460 or lower.
The average score on the ISEE is a 5, and I think 1200 is a pretty good estimate for the average score of kids at above average high schools. Here’s a sample of average test scores in Westchester County, for example. This report from NAIS is over 10 years old, but it also arrived at an average score of ~1190 for independent school students.
When you get into the 4s and lower, it makes sense to look for schools that don’t focus as much on test scores (and the same is true of scores that are below 1200 on the SAT).
I think this comparison is helpful because both scoring systems are misleading in their own way. The ISEE scores often seem really low to parents: “My kid gets straight As and you’re telling me an average of 7.5 is not bad?!” Yes! Because he’s competing against other private school kids – two 7s and two 8s are sort of like getting a 1450.
Conversely, SAT percentiles make the score look better than they are. 1100 may be an above average score, but it sure doesn’t feel that way when you’re applying to colleges that care about test scores.
One other fun thing about this chart: I think it does a pretty good job of estimating an ISEE student’s potential SAT scores. A student with 8s and 9s can definitely score in the 1500s if she keeps working in school and preps for the SAT. However, I would not use it to predict a student’s ceiling: a student who struggled to reach 6s on the ISEE could definitely score well above 1300 on the SAT after three years of strong academic growth.
I’m using the average of the four ISEE scores (even though they are never presented that way), because I’ve noticed that that number is more consistent over time.